Data analysis – data visualization – data access
The measurements are aggregated and related to each other.
Thanks to our expertise from decades in the track, we can coherently interpret the complexity in terms of data volumes and their significance and visualize them as simply as possible.
- Automatic data evaluation with the mapl-e platform (Laser Rail Scanning) measuring system & mapl-e are designed for joint application)
- Growing data pool with every measuring run
- Algorithm-based data processing in real time
- Clear & easy to understand results
- Independent assessment of the data by the user
- Various depths of detail
- Easy access to mapl-e via browser from any terminal device
- Secured & centralized database
- User-friendly navigation & configuration
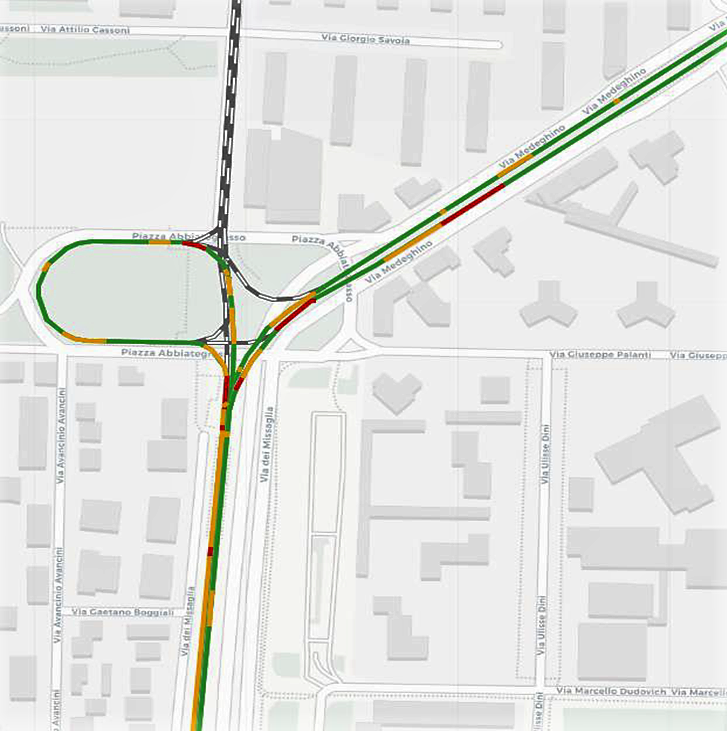
- Intuitive visualization of the rail condition with traffic light colors

